Client: Neurotype
Users: Therapy Clinics, Substance Use Disorder (SUD) Therapists & Patients
Tools: Figma, Slides, Notion, Miro, Invision, Zoom, Otter
Process & Methodology: Competitive Audit, Secondary Research, User Journey Mapping, Stakeholder & User Interviews, Low Fidelity Prototyping, Usability Testing, Follow-up Interviews, Interactive High Fidelity Prototyping, Synthesis of Findings

The Challenge
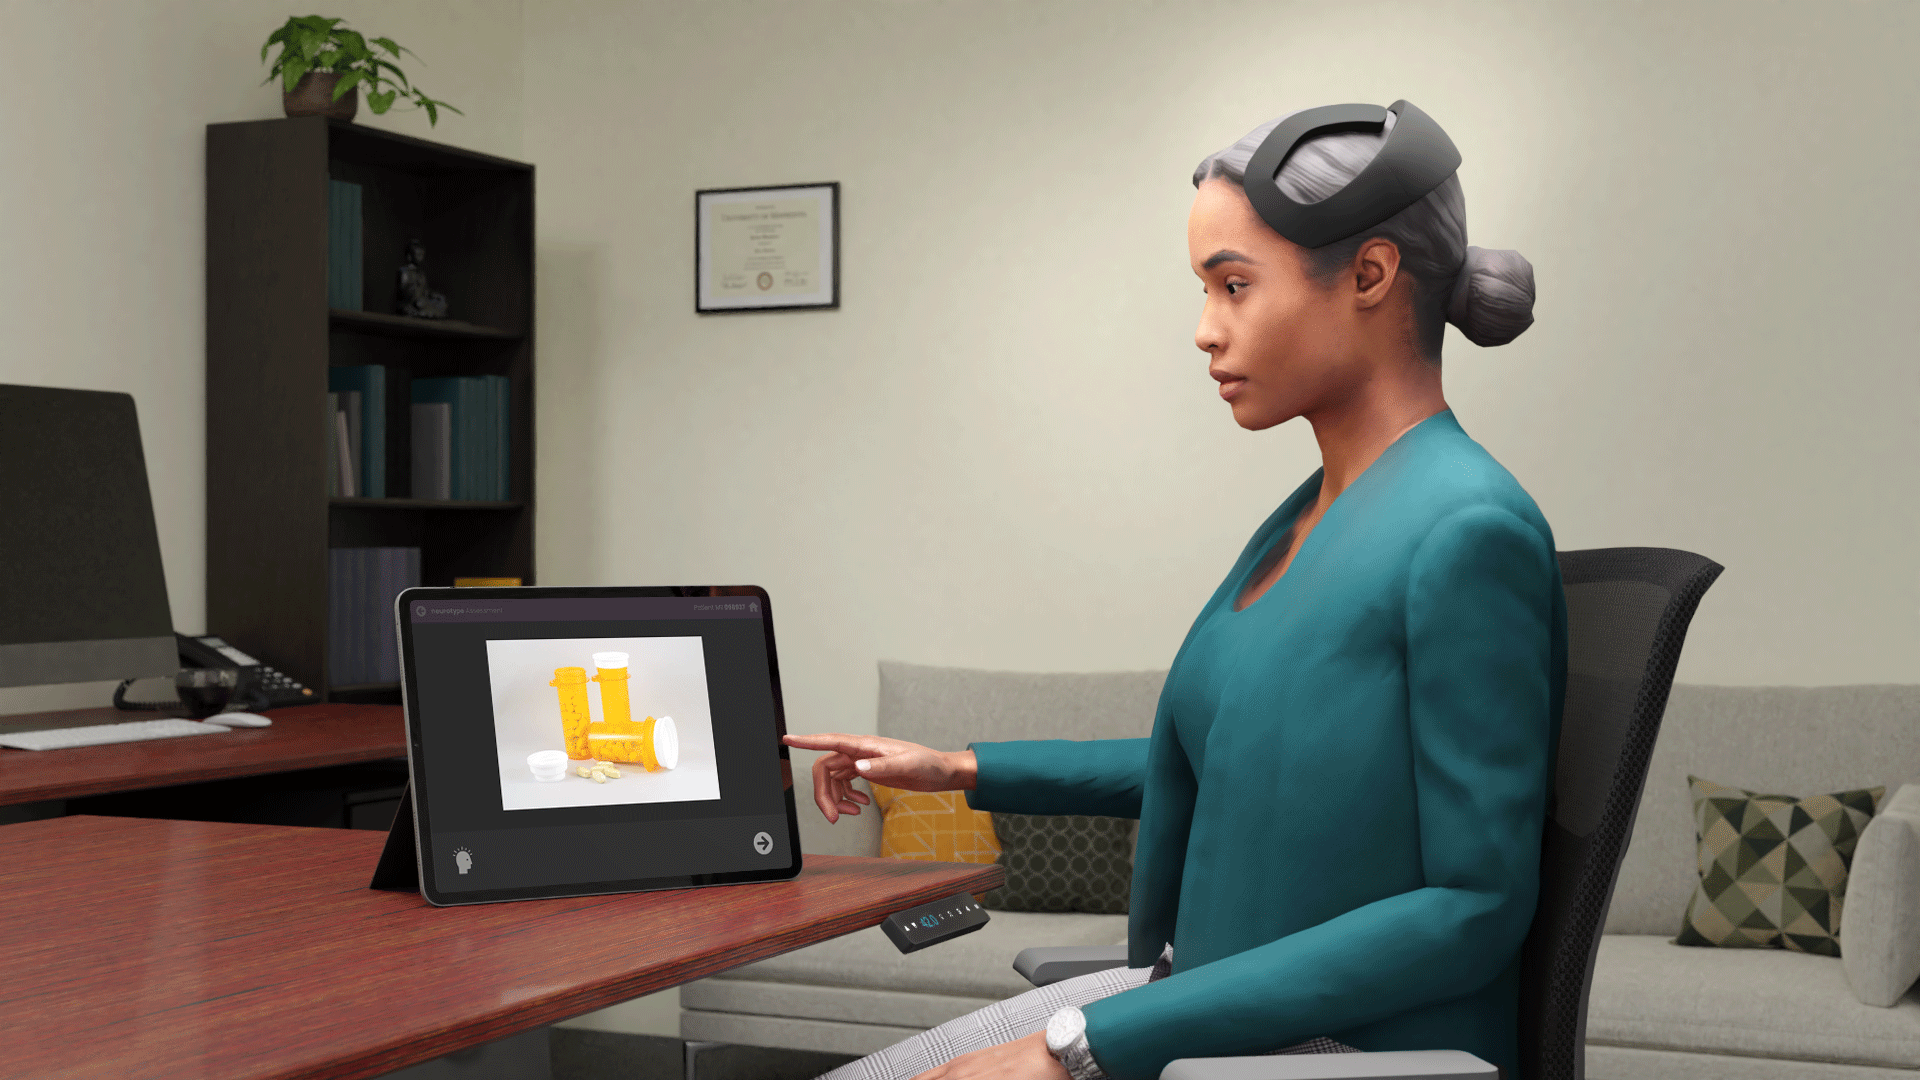
Neurotype, an early-stage medical start-up, is focused on developing a product to be used as a tool to treat substance use disorder. Neurotype plans to develop a photo activity assessment that utilizes a mobile electroencephalogram (EEG) to measure brain reactivity to imagery compared to the patient’s self-reported reactivity. It was our challenge to determine how users could effectively deploy Neurotype within the established SUD treatment methodology.
The Solution
Our team’s path to discovering the solution began with initial research of EEG technology and SUD treatment methodologies. We then used this base knowledge to inform user interviews, which helped us develop low & high-fidelity prototypes for usability testing. Finally, our team shared our solutions with the stakeholder through a live presentation and delivered materials.
In brief, we found that the users would like the ability to customize the product and data view for each client. We also discovered that the users had limited time for treatment. Therefore, the product should be efficient or used as an assessment outside of weekly therapy sessions.

My Tasks and Roles
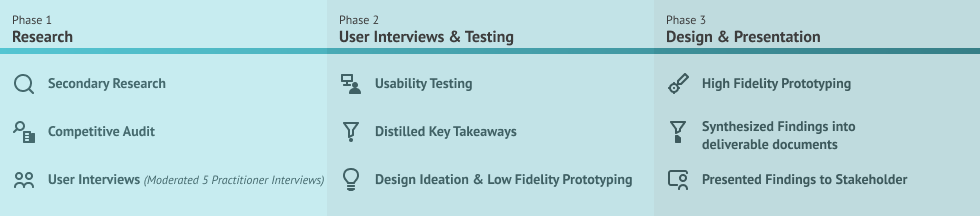

Phase 1
What is this new technology? How do users participate in substance use disorder treatment?
We began this project with research to acquire a base understanding of EEG technology and SUD therapy treatment programs. Our team split up our research to make the best use of time.
Having some familiarity with consumer EEG devices, I decided to work with a teammate on a competitive audit of the EEG device that Nuerotype planned to use. We also conducted secondary research to find case studies or products that similarly used EEG technology.
Most of the information our team discovered was dense and technical. To save time, our separate team groups condensed what they had learned into high-level findings and shared those insights in a meeting with our entire team. We organized the detailed data in a shared location in Notion for easy access and reference.
The way we conducted our initial research enabled our team to quickly acquire a basic understanding of mobile EEG technology and SUD therapy treatment programs. This basic understanding helped our team clarify project goals and aided our ability to ask informed questions in the following stakeholder and user interviews.
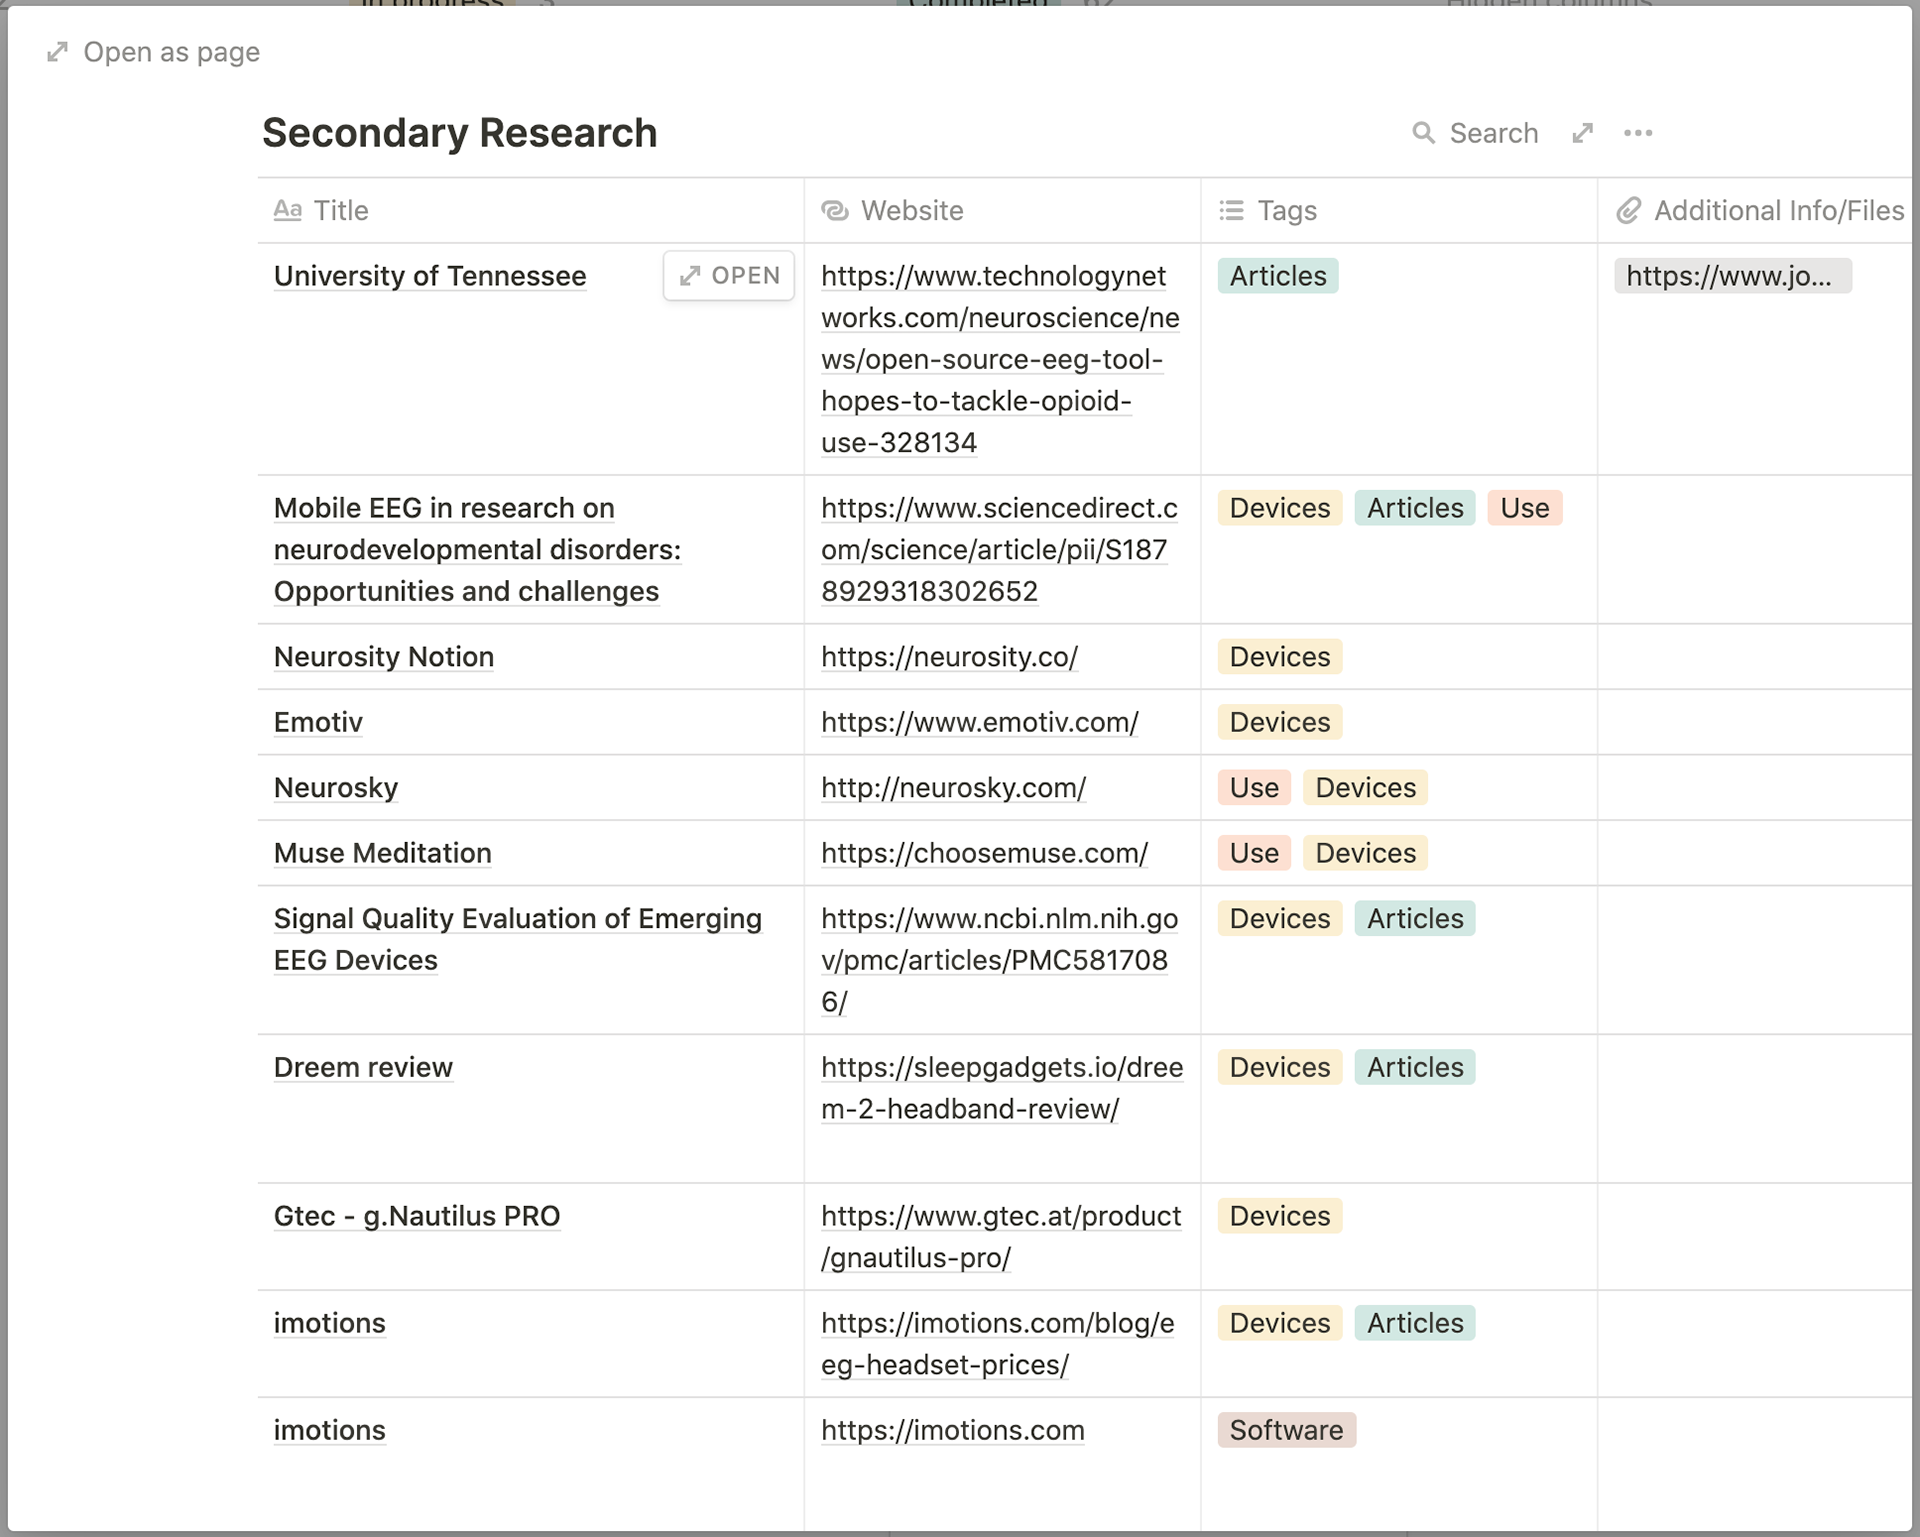
Screenshot of one the notion tables containing initial secondary research and competitive information.
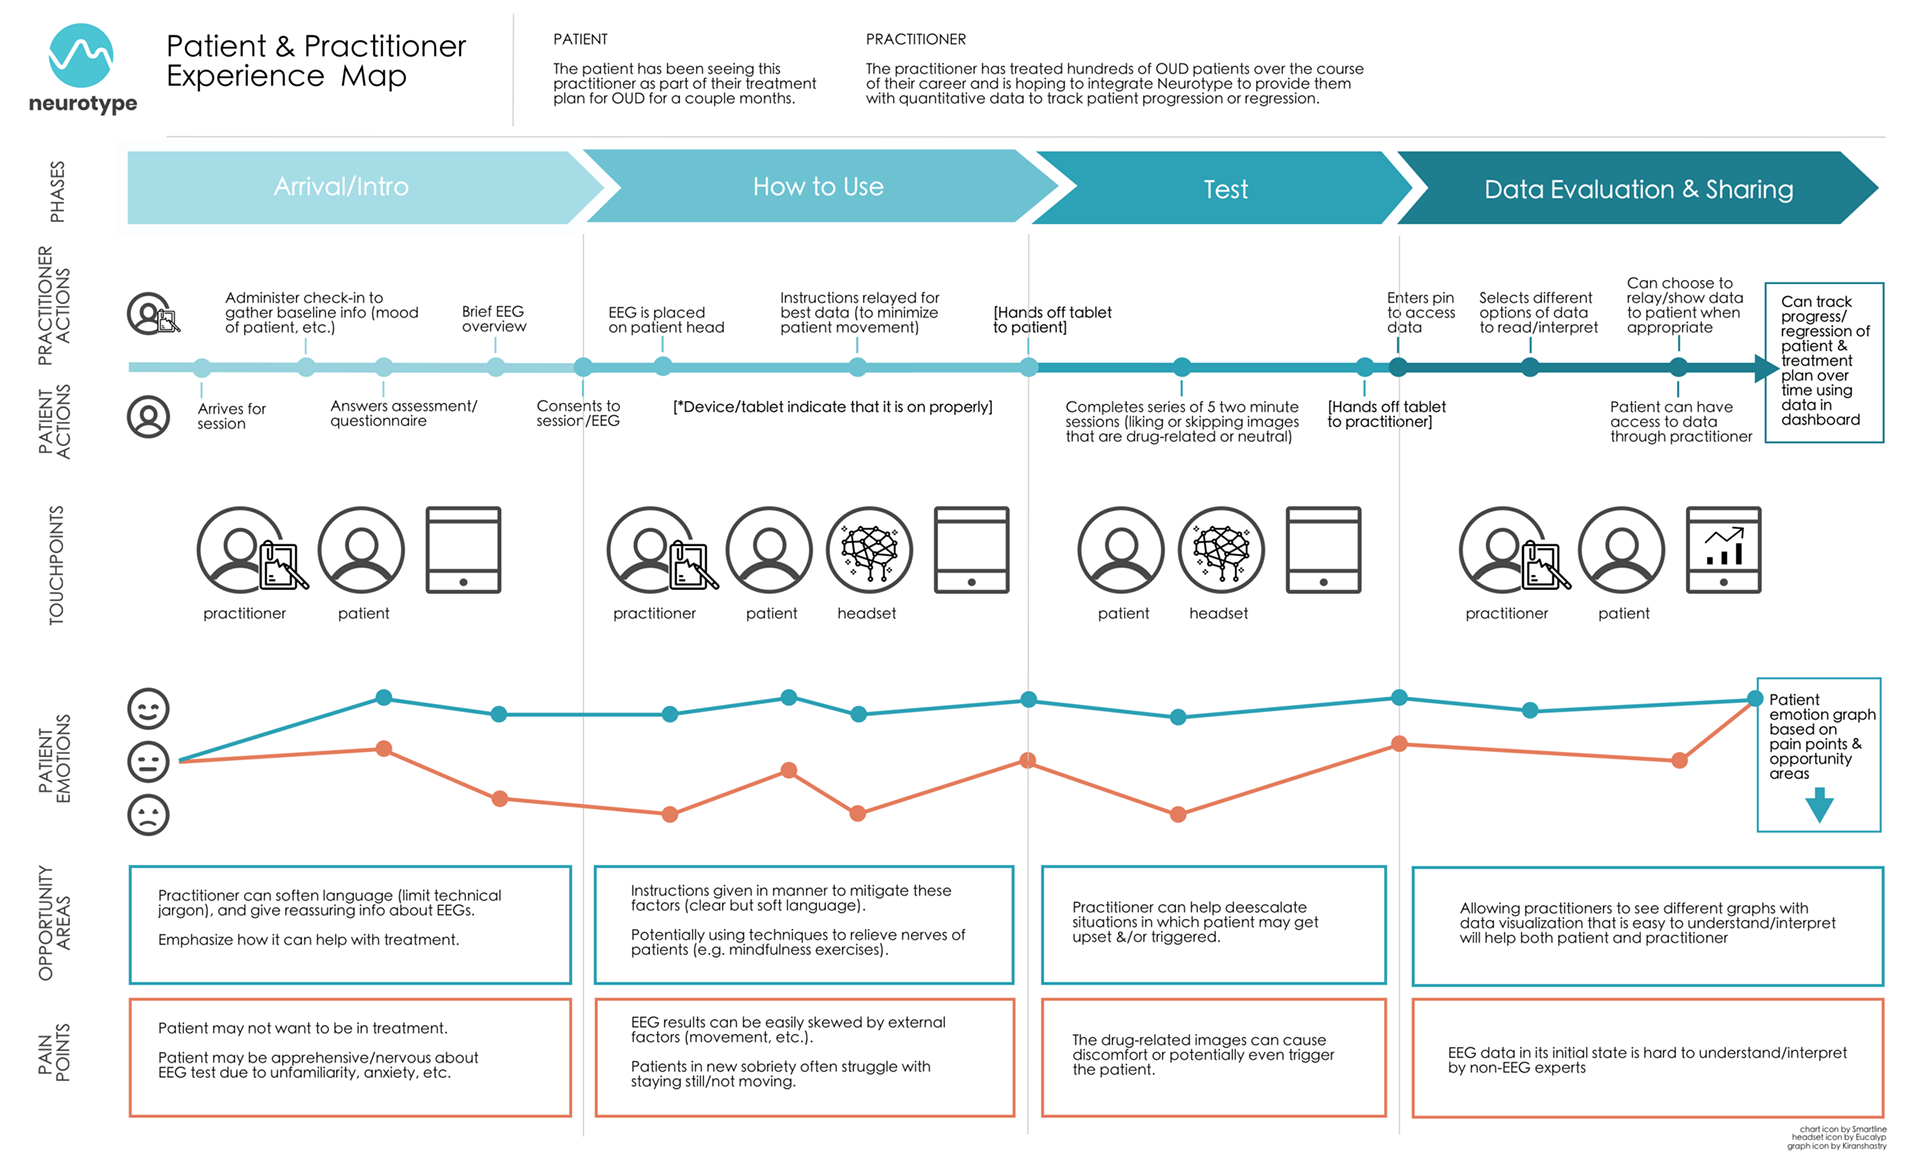
User Experience Map created by teammate Laura Gunther.
During this first phase, we began creating a user experience map to organize user interactions visually. This chart grounded our team along the path of the users, helped us along the app design process, and aided discussions with our stakeholder and user interviews.

Phase 2
The user’s perspective.
The user’s perspective.
After gathering initial information, we still lacked a user perspective on substance use disorder therapy. So, our group thought it was best to conduct interviews with experienced people in the field.
In total, we interviewed 12 people, 5 of which I moderated. These 12 people came from backgrounds in therapy, health, medicine, social service, and data visualization. As a result, the interview process revealed similar excitement, concerns, insights, and perspectives among our participants.
We learned that, first and foremost, this technology would have to be vetted through clinical trials before practitioners would consider using it. We found that the product would most likely work best in larger clinics during inpatient treatment due to the potential costs related to the device itself and the need for training or a trained technician to administer the assessments.
Furthermore, if the patient’s primary therapist conducted assessments, practitioners voiced concerns that administering the test would take up valuable time during the once-weekly outpatient therapy sessions. We also found that the SUD community may have specific concerns about using technology of this nature or that the data may motivate some patients to change their lives.
During the interview process, we began to introduce low-fidelity prototypes to gather insights through usability testing. Reacting to these prototypes helped us better understand how the practitioners use technology in their practice and how this product might fit into their workflow. It also allowed us to understand what the practitioners expect and want to see in data visualization. We then used the information gathered in this stage to refine our prototype and began on a synthesized report.
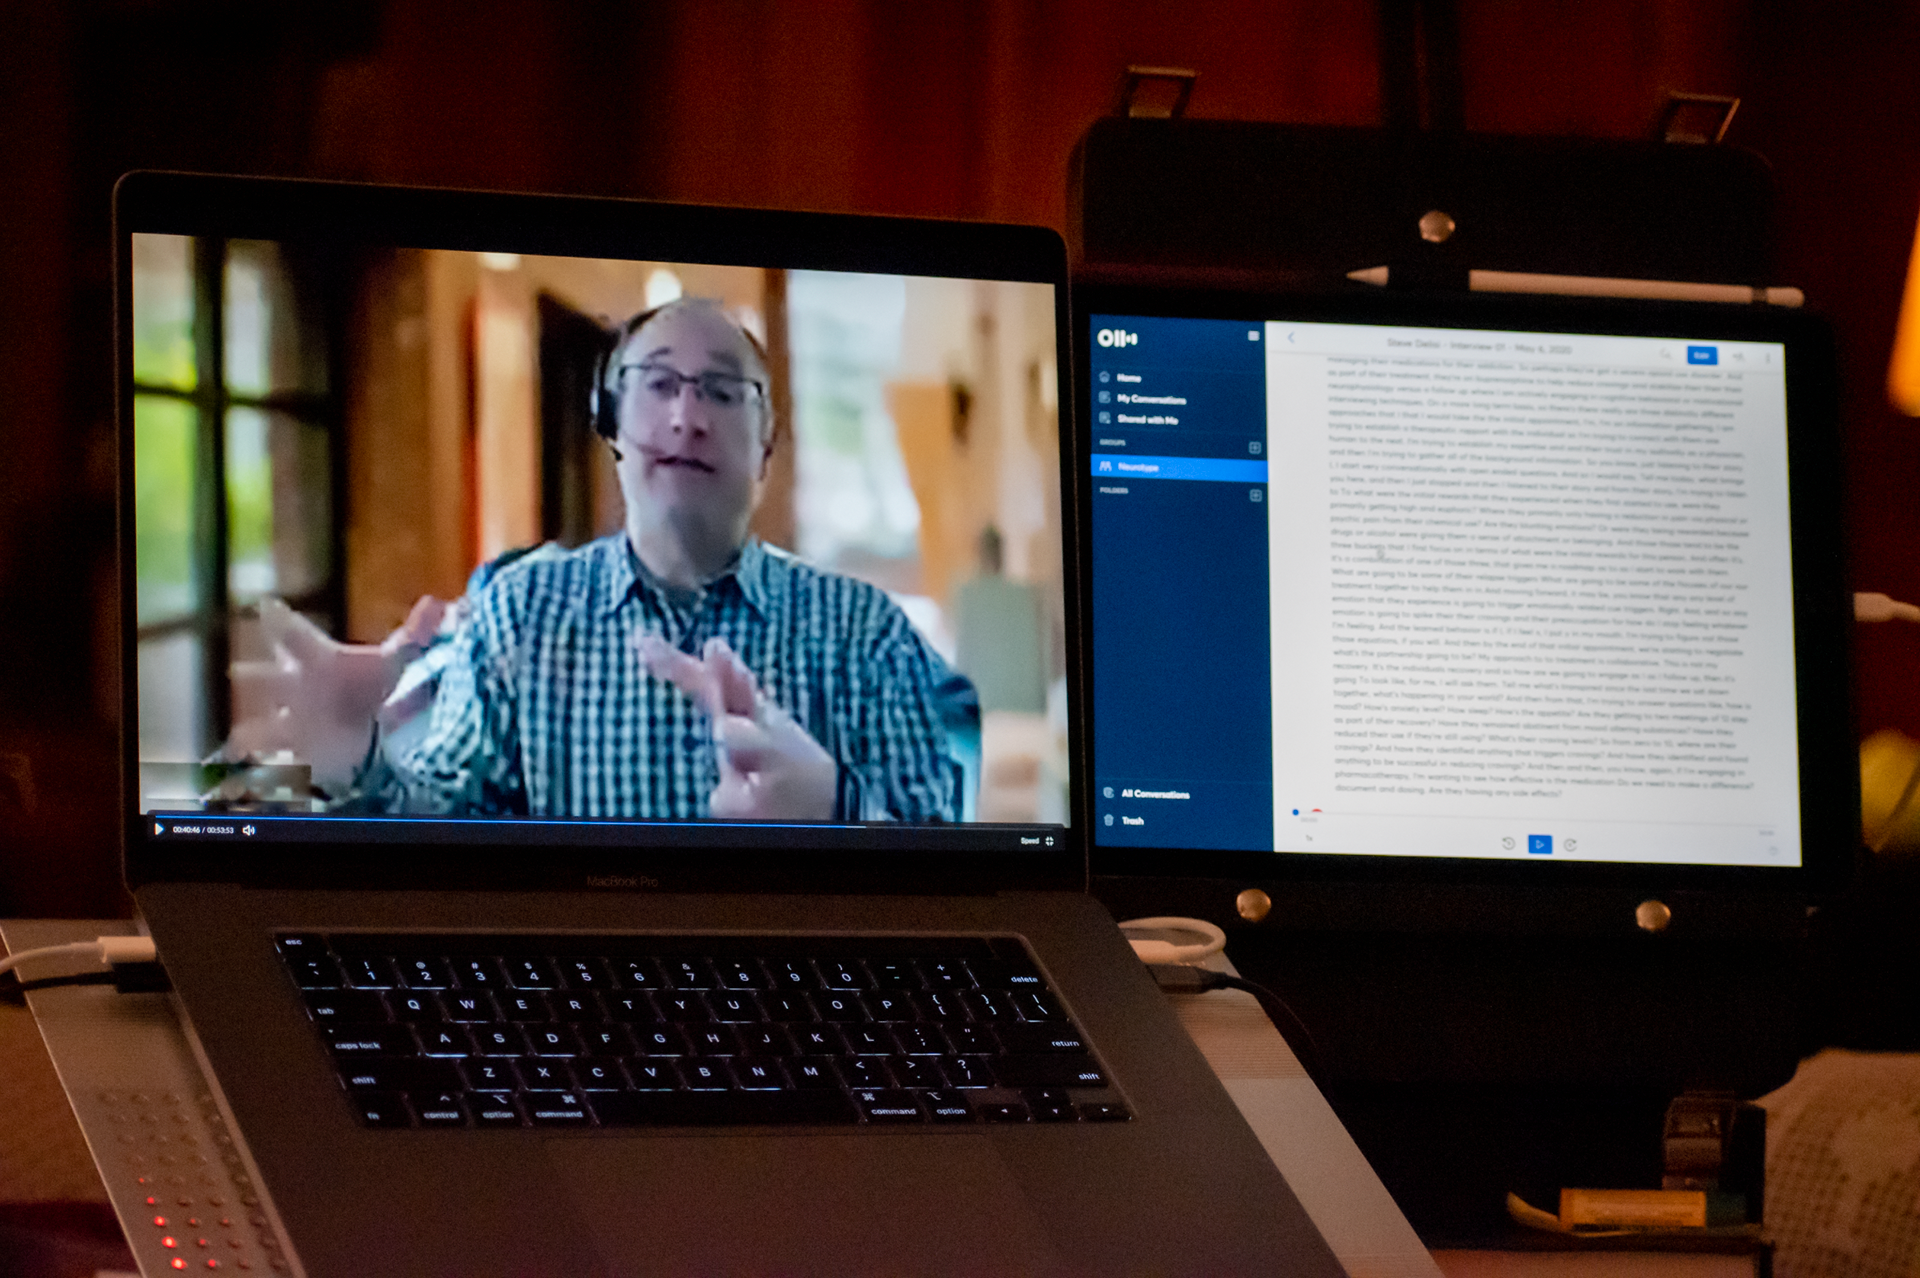
A photo from one of the remote interviews I moderated. I ran several solo interviews; however, in this instance, a group member joined to take notes. We used Zoom to host the video calls and used Otter to transcribe the conversation.

Phase 3
Building on what we learned.
Building on what we learned.
Our first round of interviews left us with heaps of information. Unfortunately, our team wasn’t on the same page, and we didn’t have time to participate in or listen to each interview. At first, we found debriefing after interviews helpful, but it took too much time. So, to save time, we distilled each interview’s top 5-10 takeaways onto an affinity diagram and sorted those insights into themes and categories.
The insight gained from organizing the information we acquired through our interviews helped us make significant changes to our application prototype and user journey map. At this point, my role transitioned into working on the application prototype. I used my experience in graphic design to convert our wireframes into cohesive high-fidelity designs by creating and implementing a style guide.
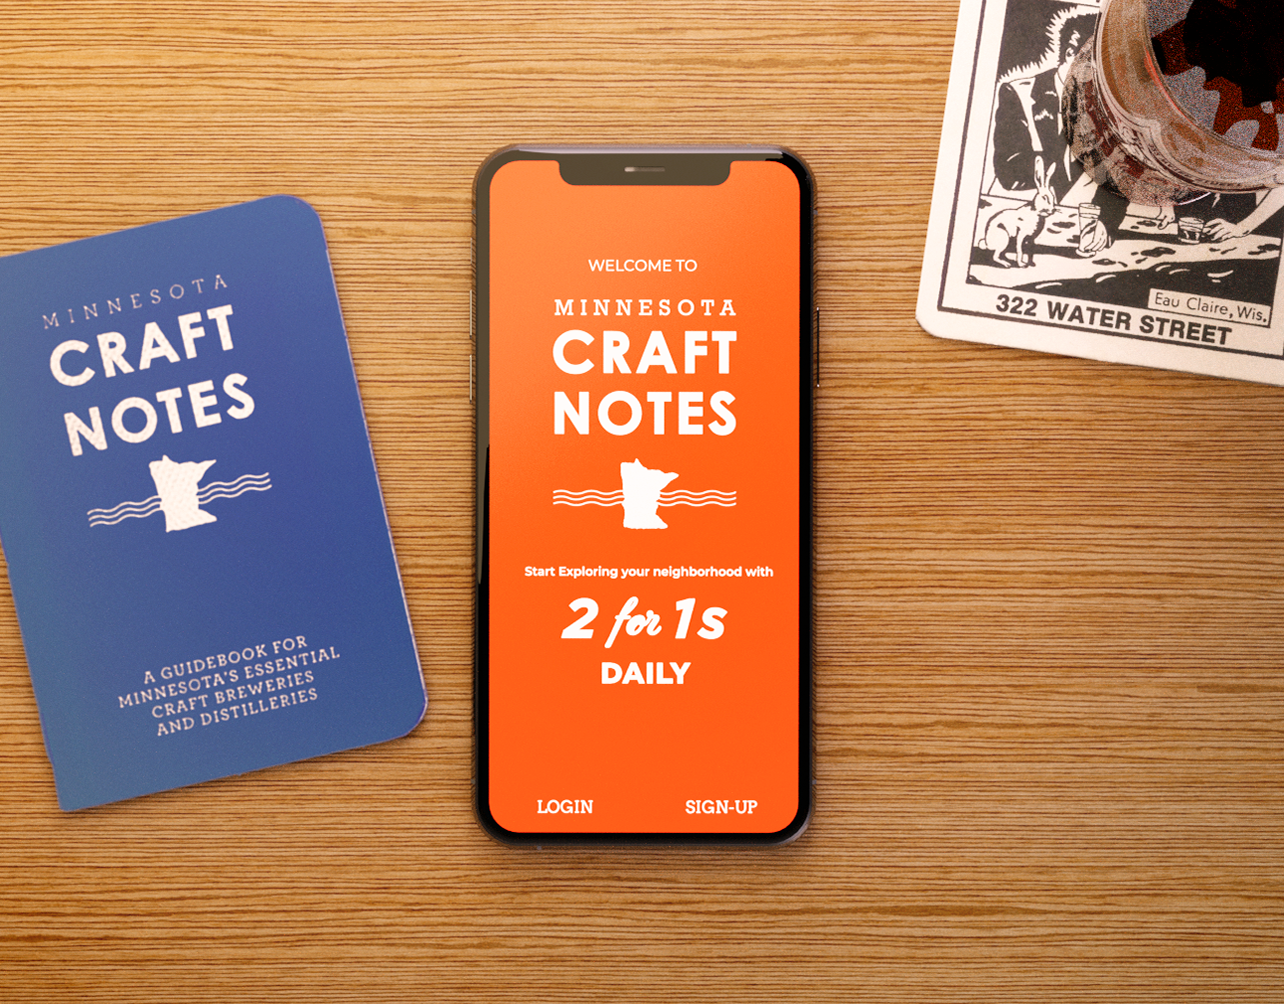
As observed in usability testing, many people didn’t understand what to do when they arrived at the photo assessment section of the application. Experienced interviewees informed us that tests like these would require adequate documentation on administering the test. They also mentioned that patients might require education to take the test effectively. Seeing an opportunity, I quickly made a series of screens that explained how to take the test. In this basic walkthrough, seen below, concise information and instructions are shared, and then the user is given practice with a few test images.
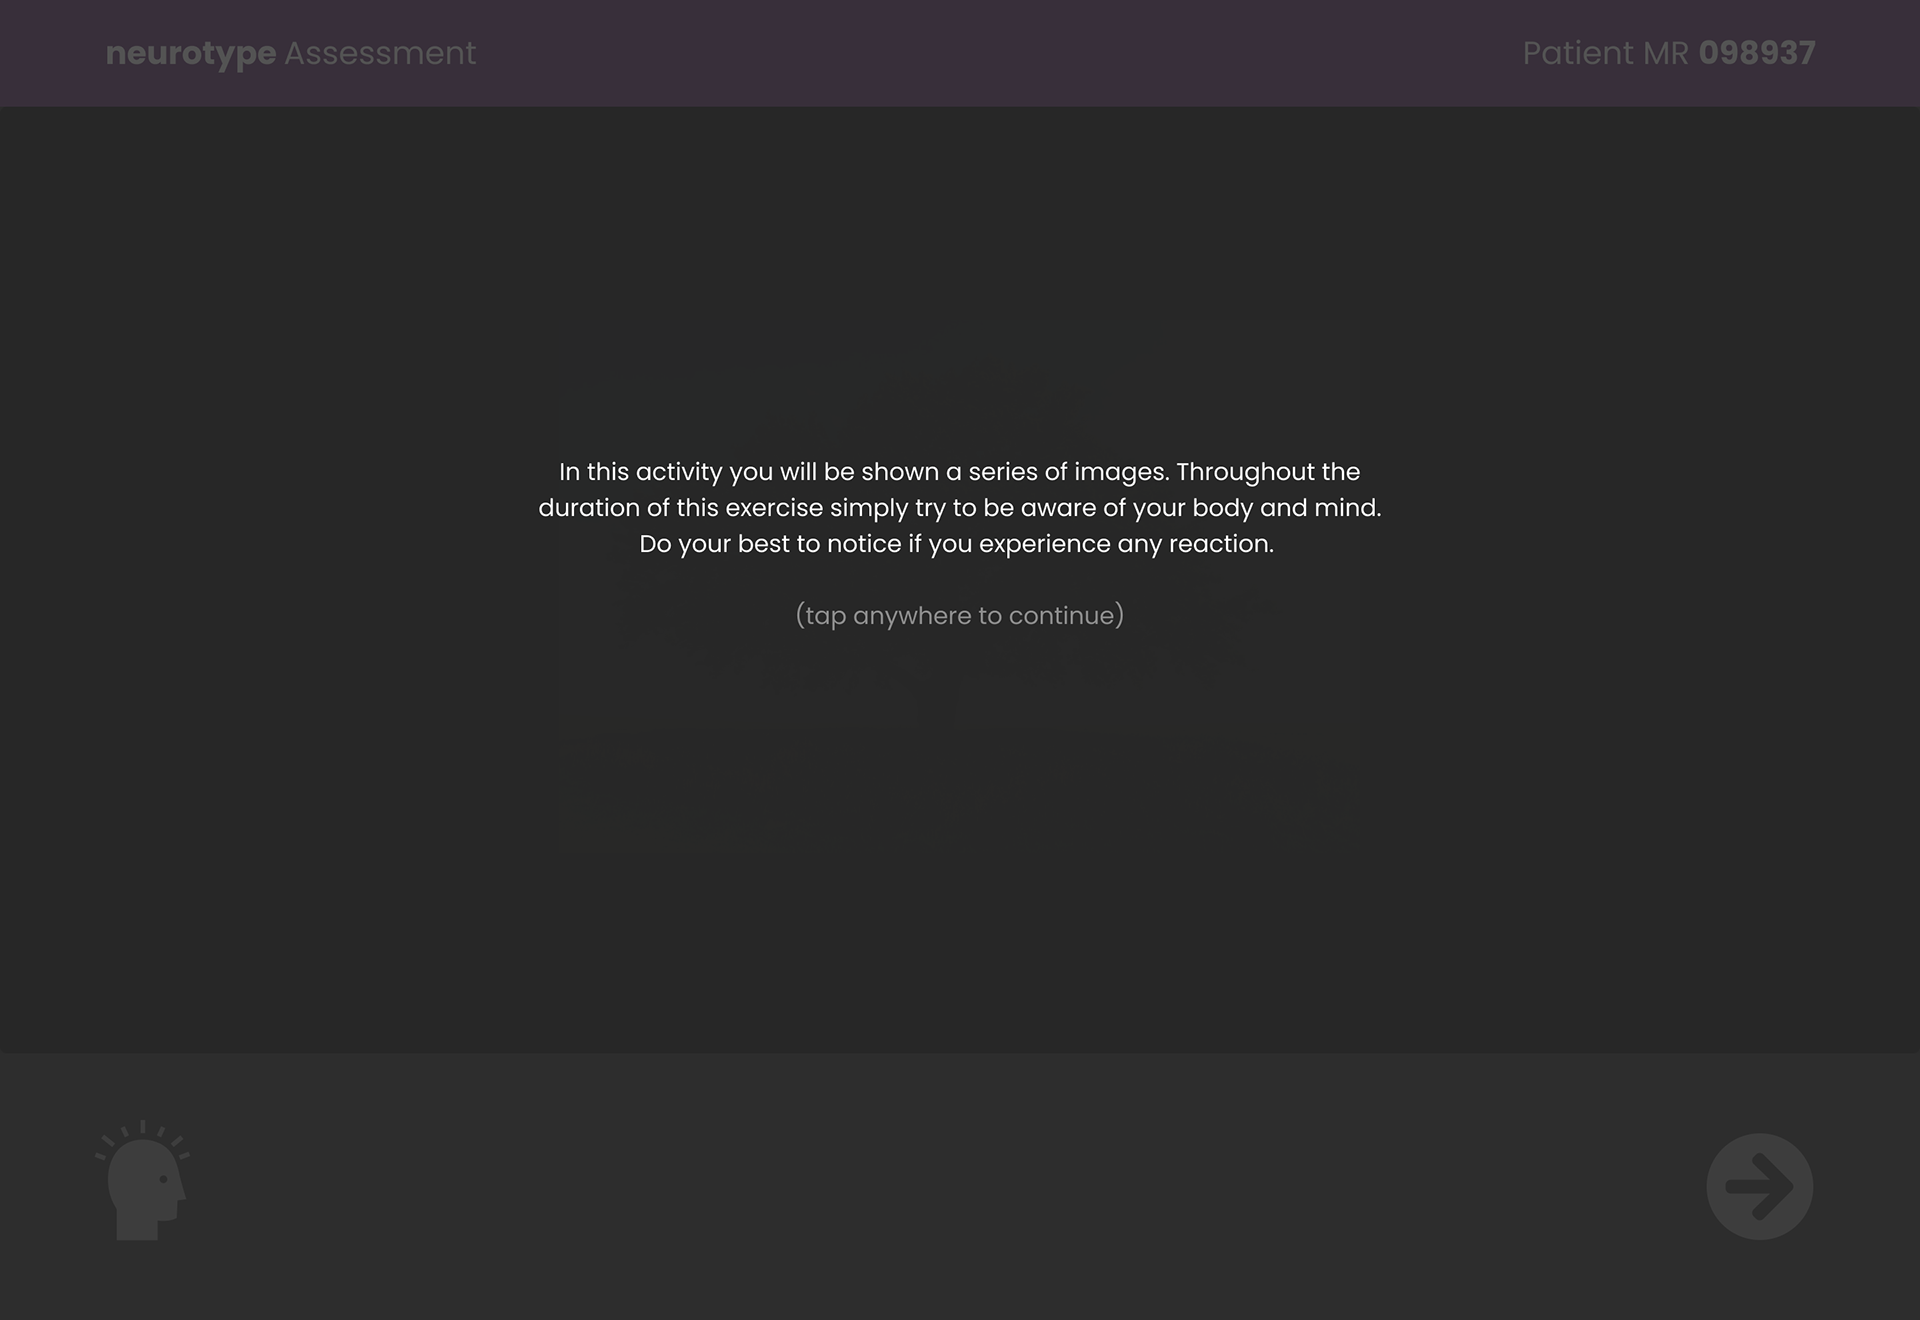
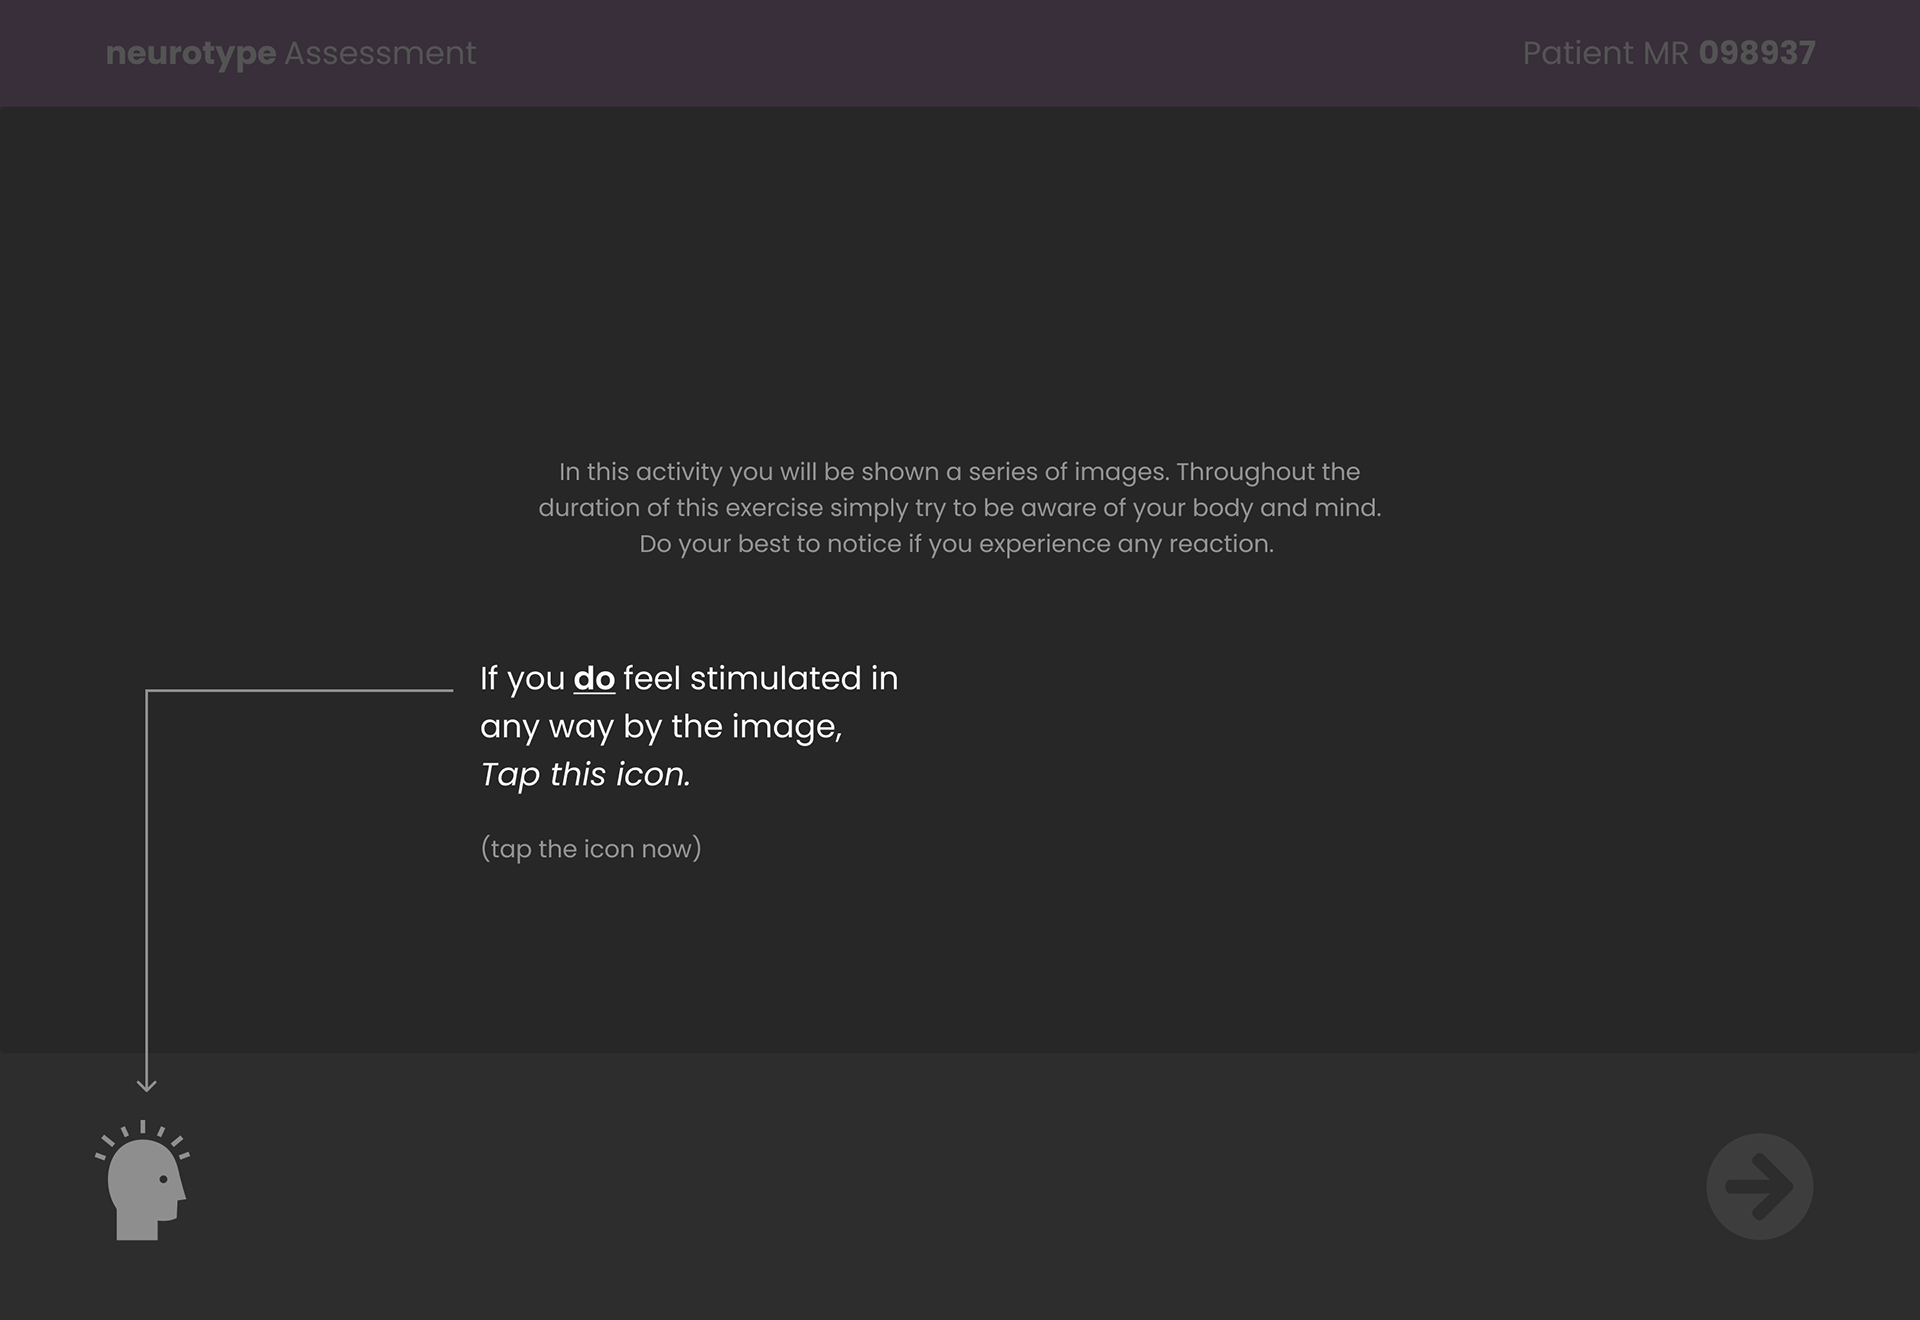
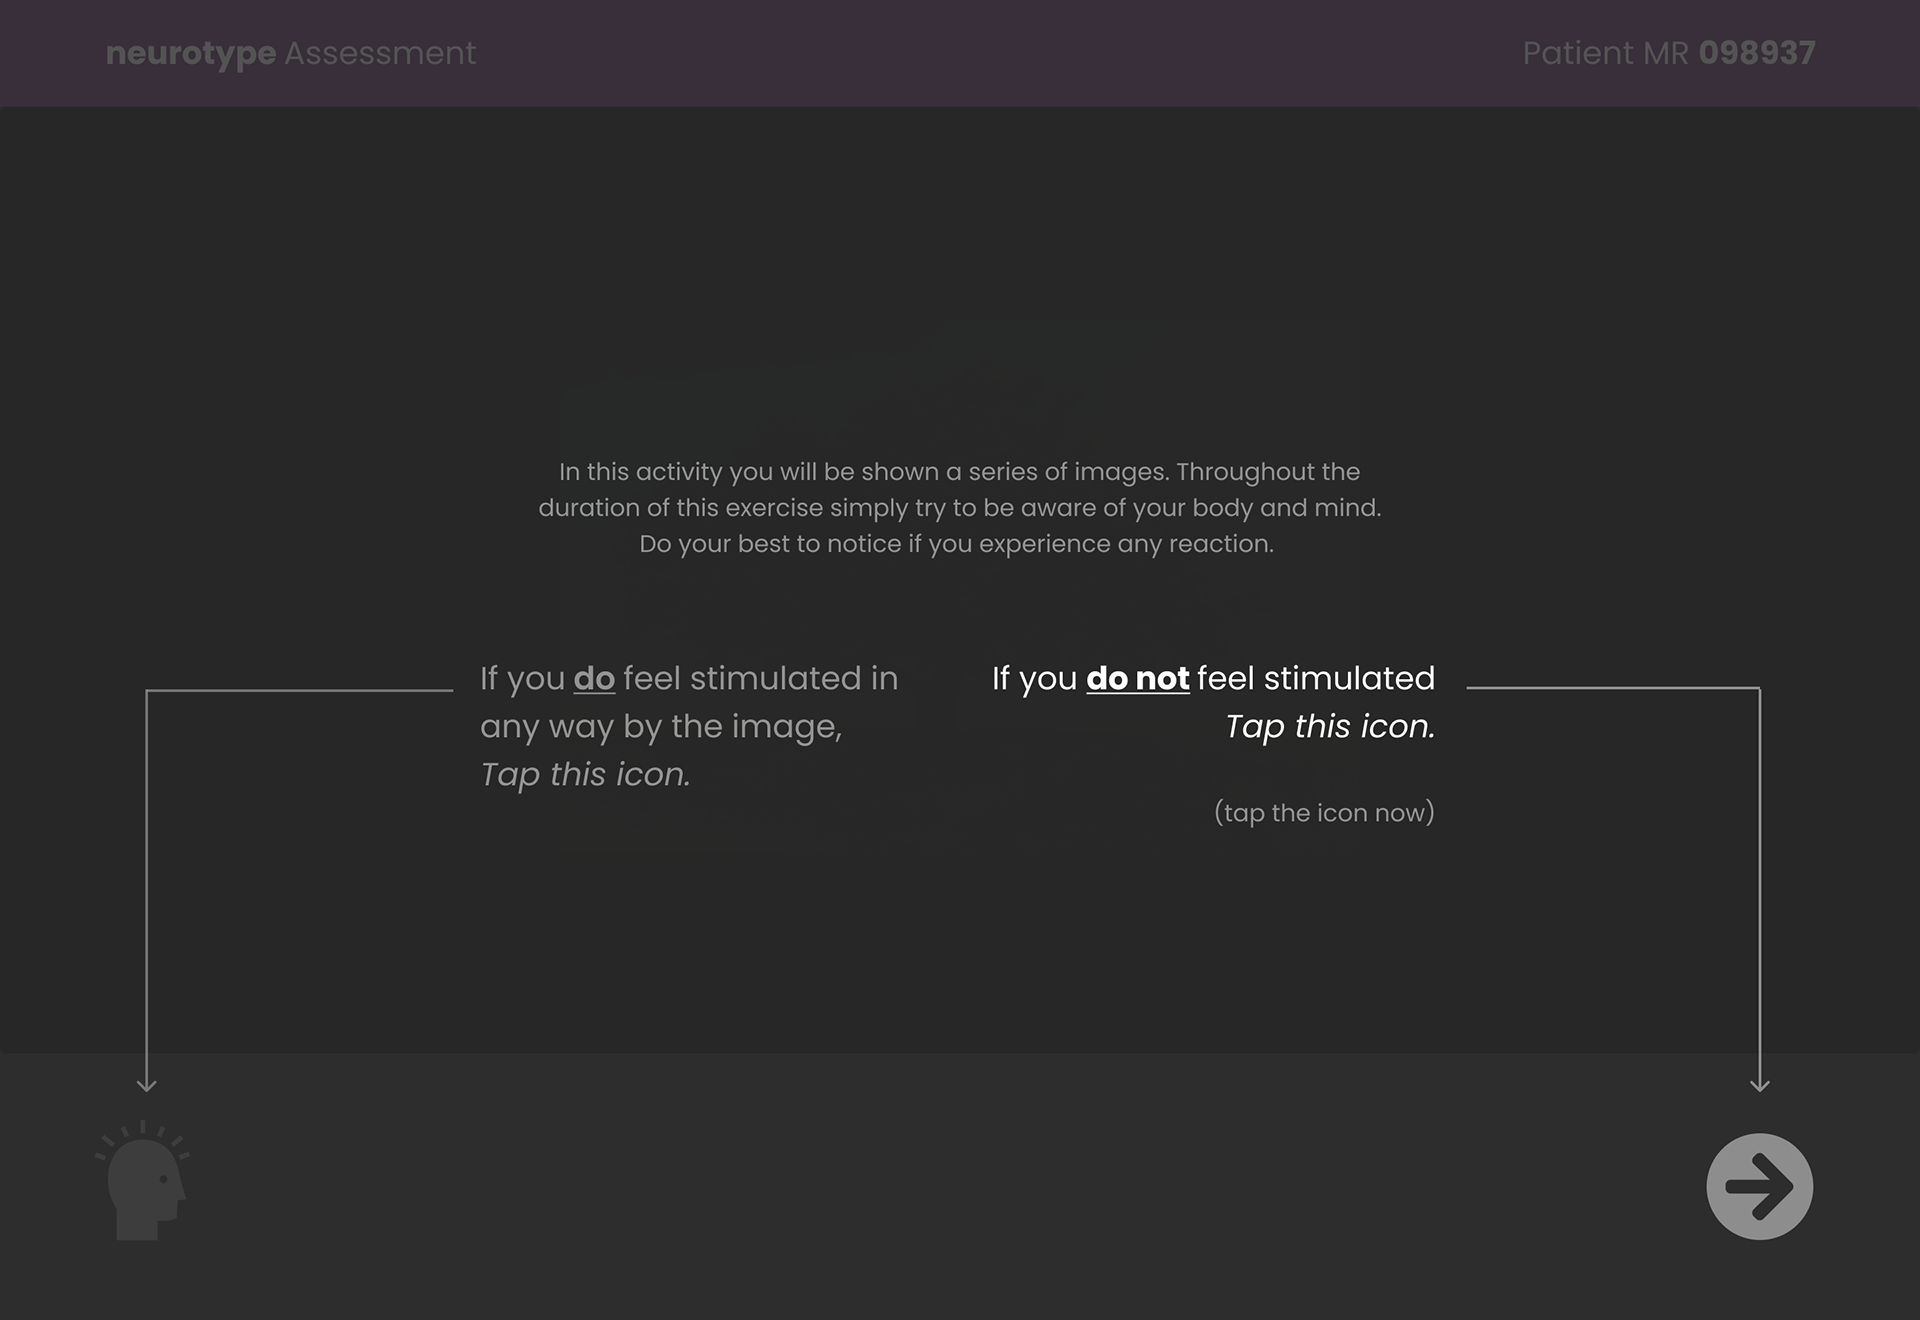
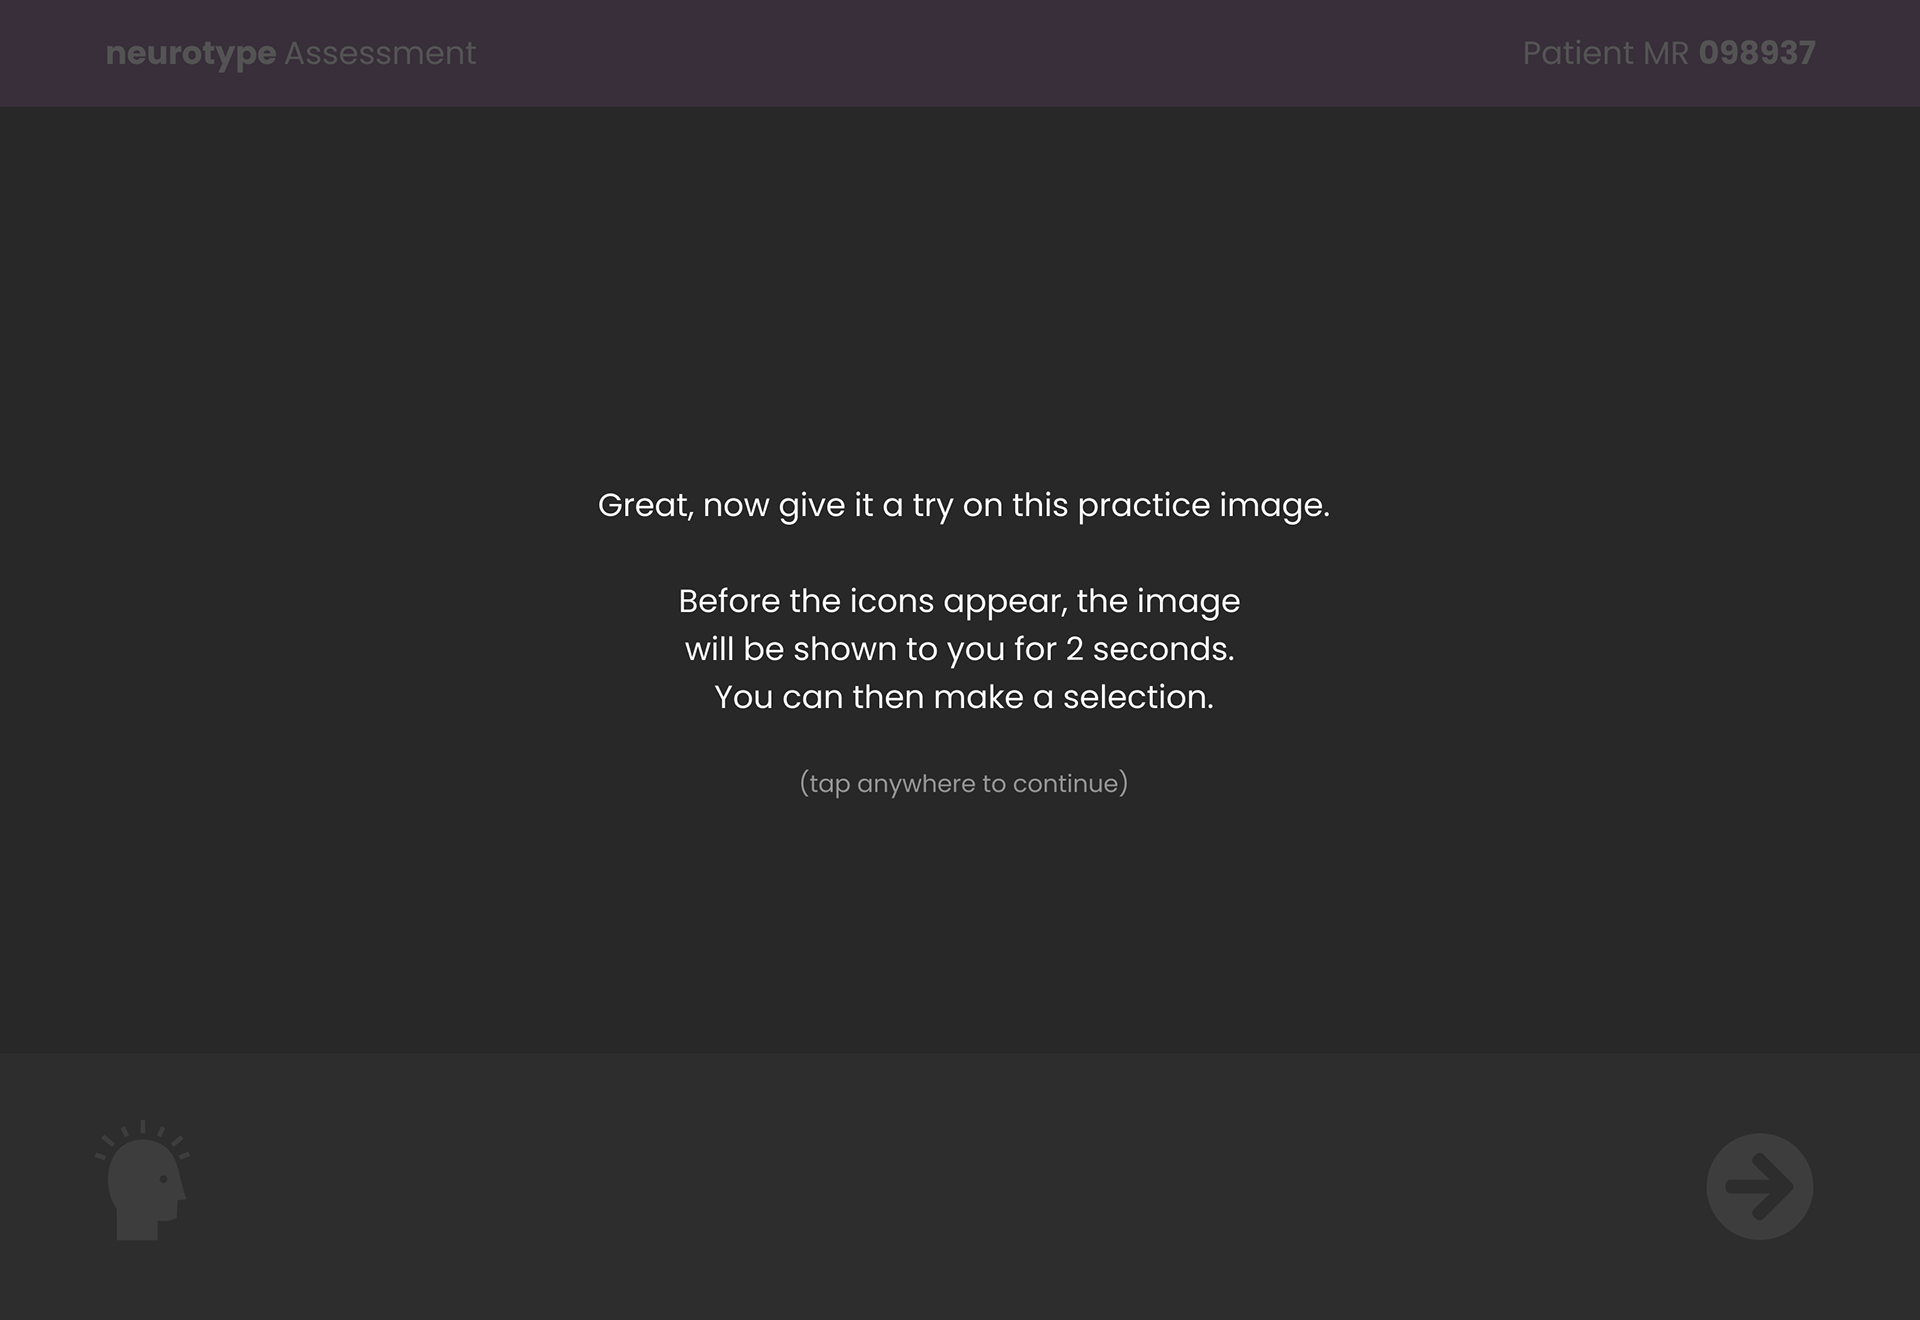
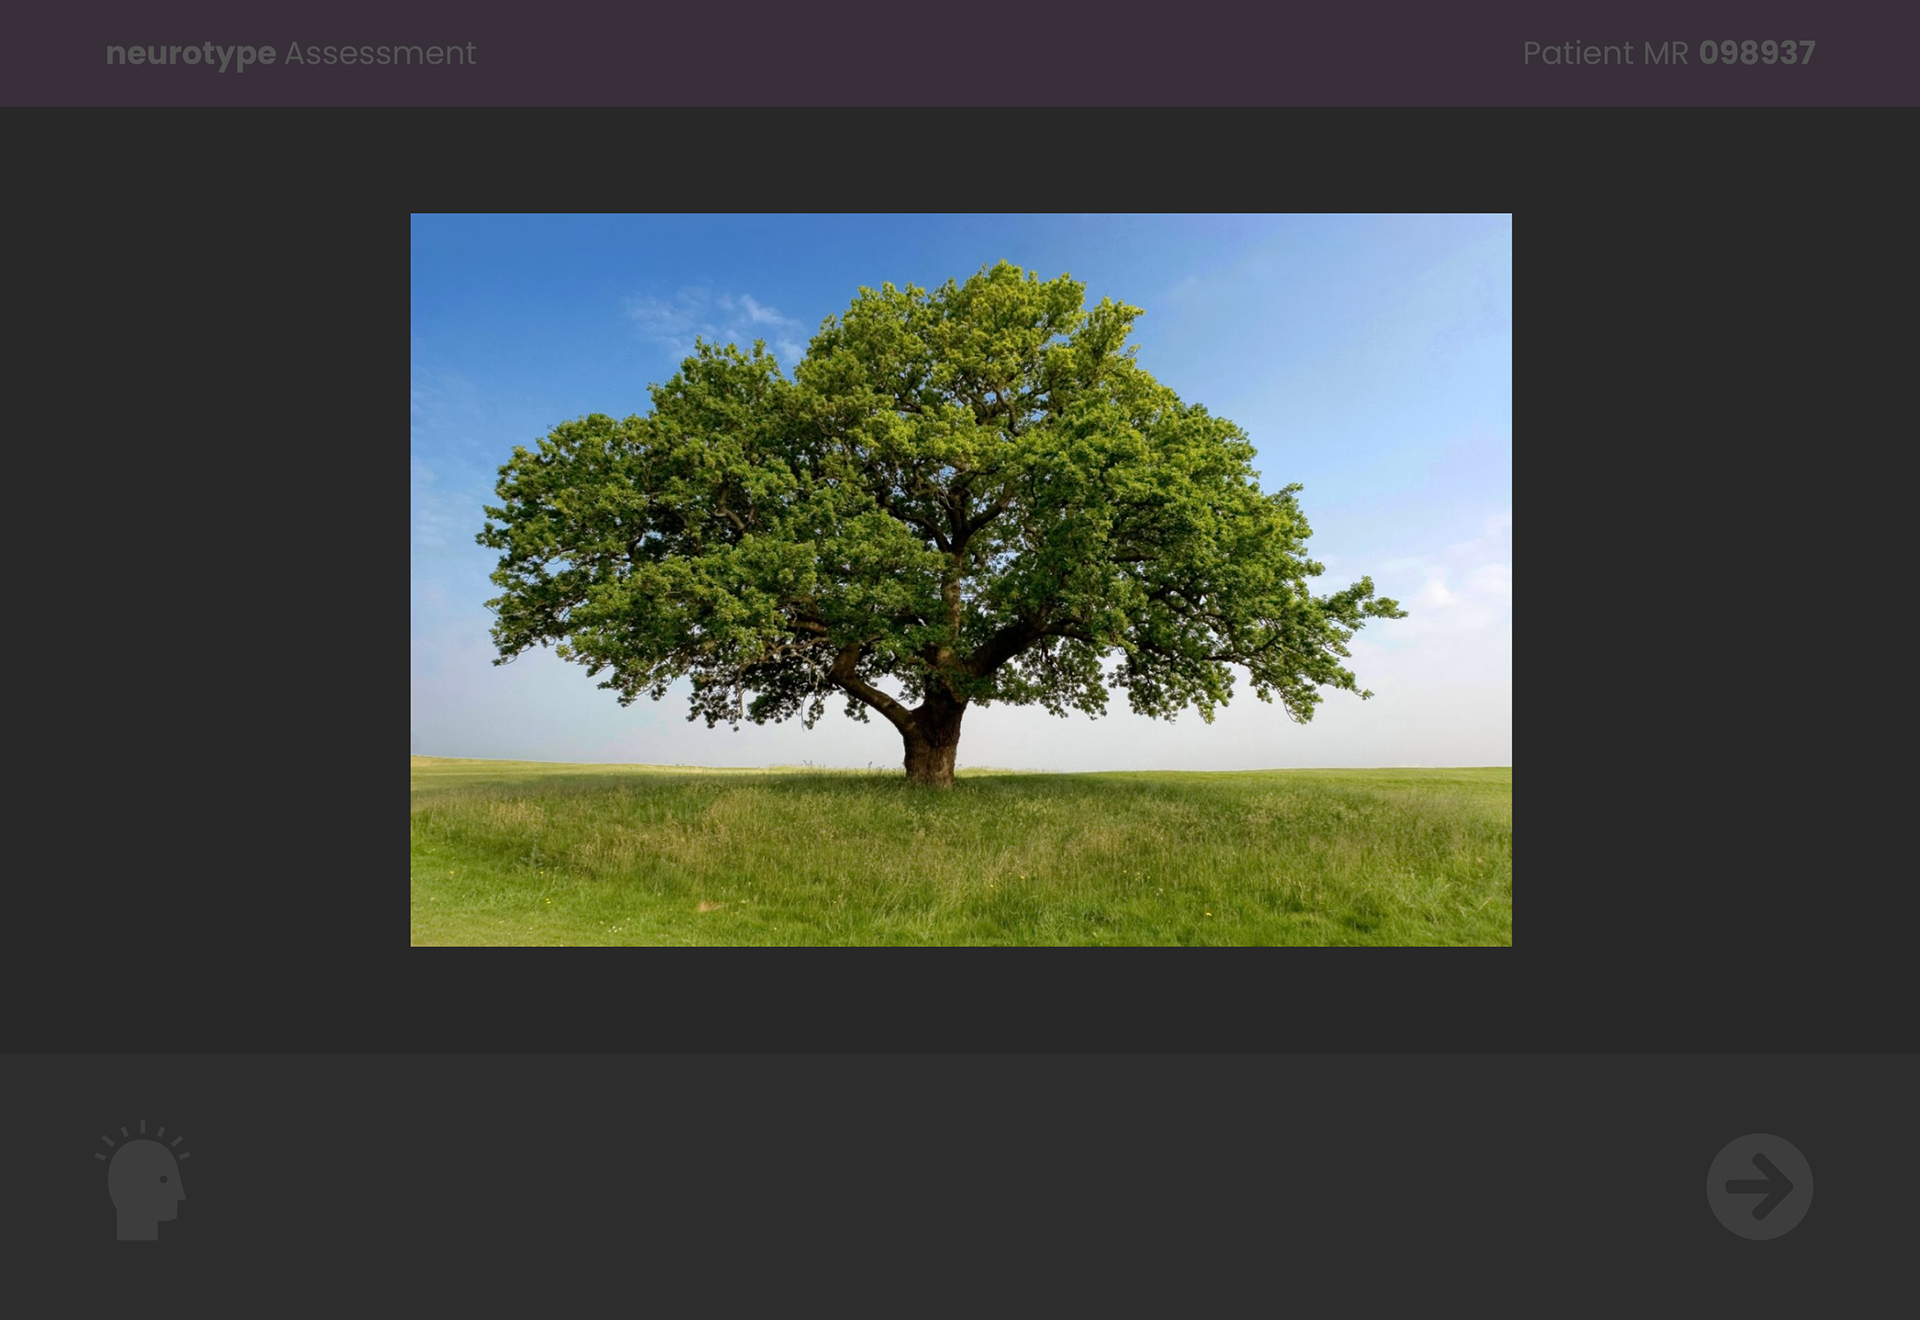

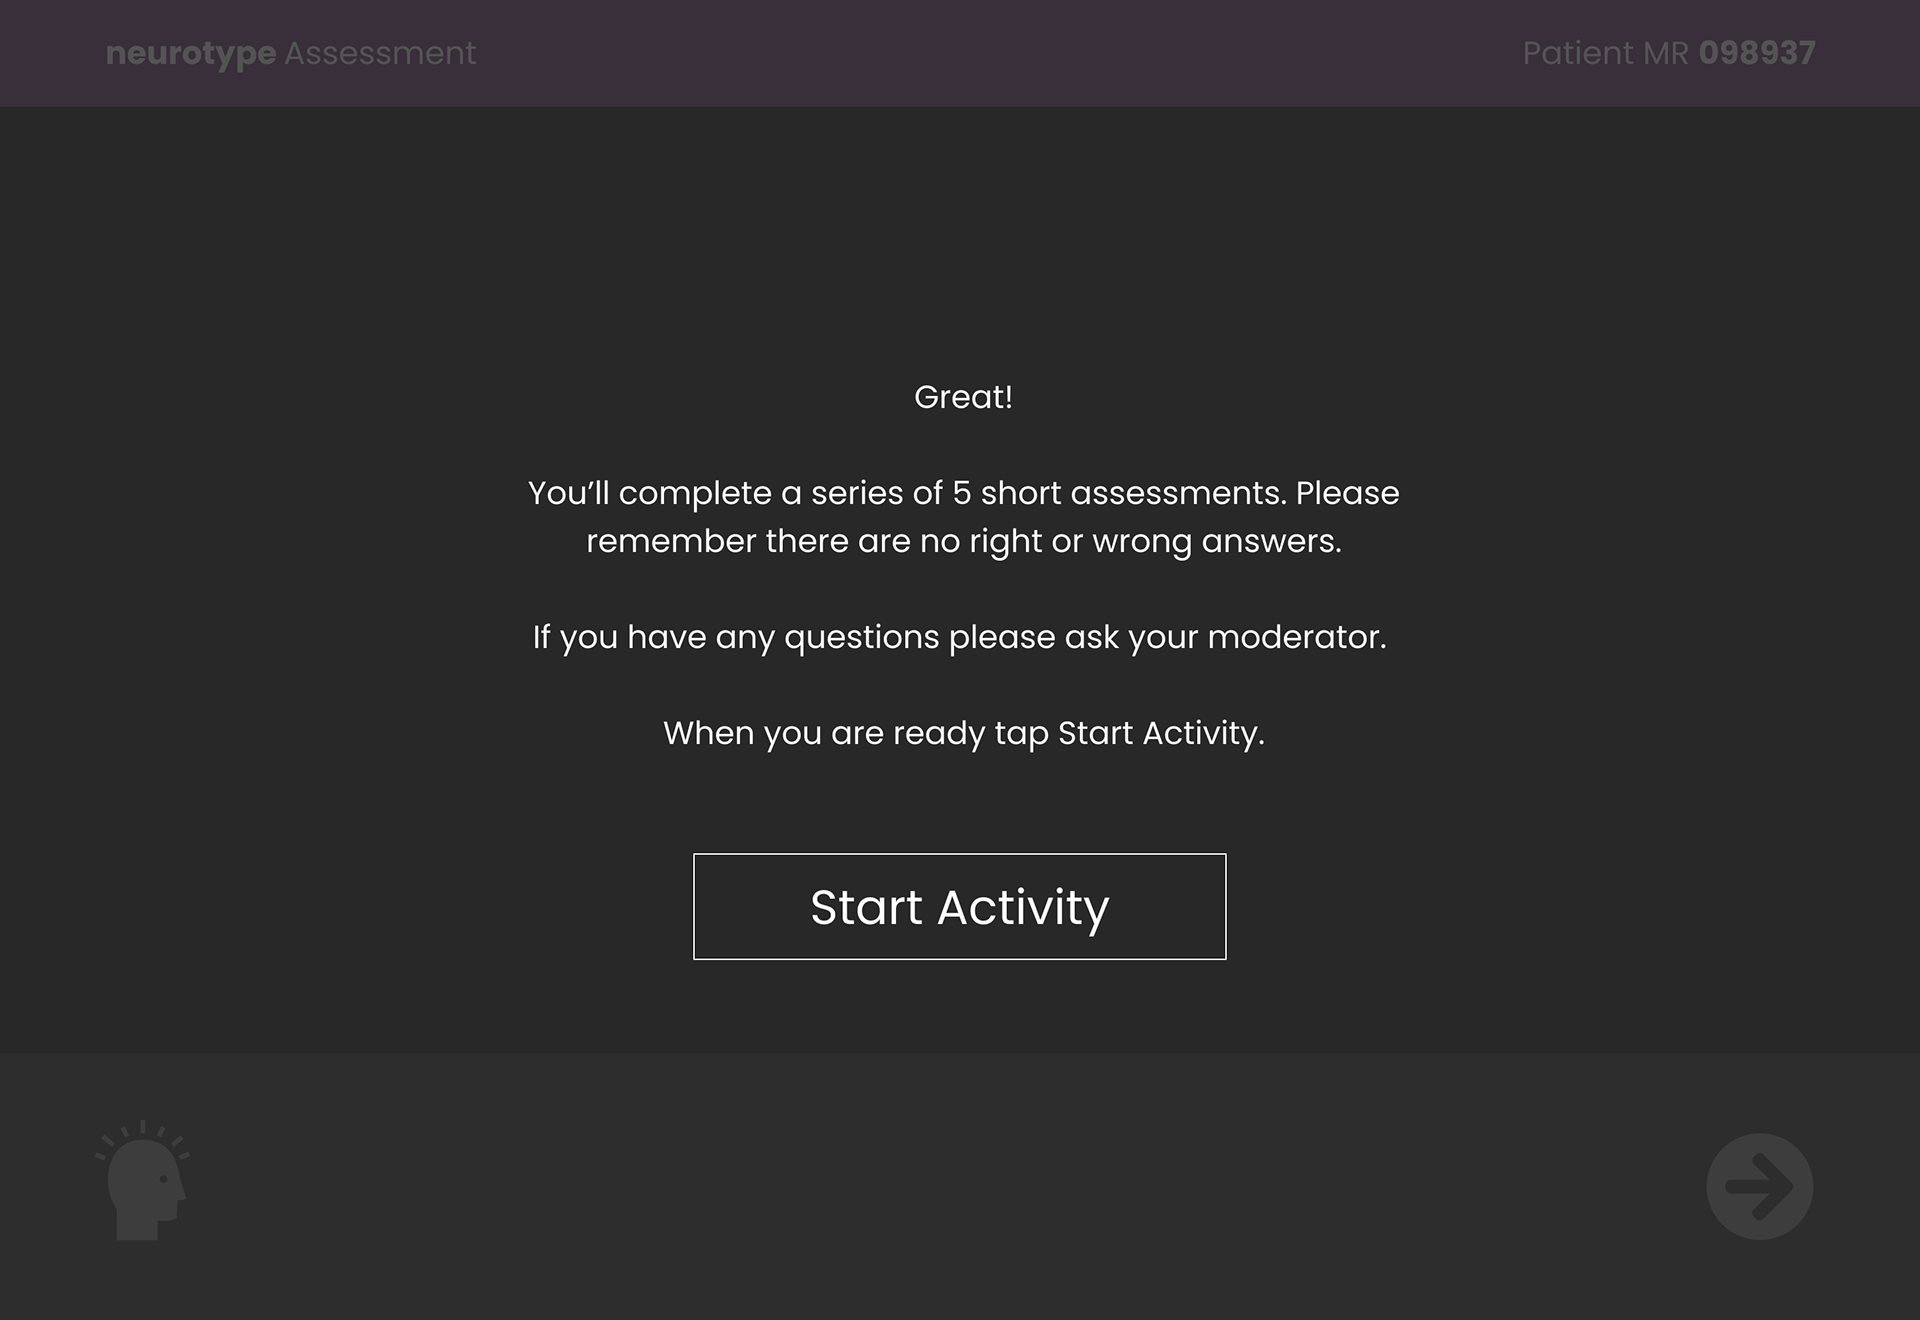
Photo Activity Instructions Flow
While making headway on the high-fidelity prototype, our team needed help finding the best way to represent the EEG data collected during the image test. So, we reached out to a data visualization expert for insight. His information helped us simplify our approach by grouping data visually.
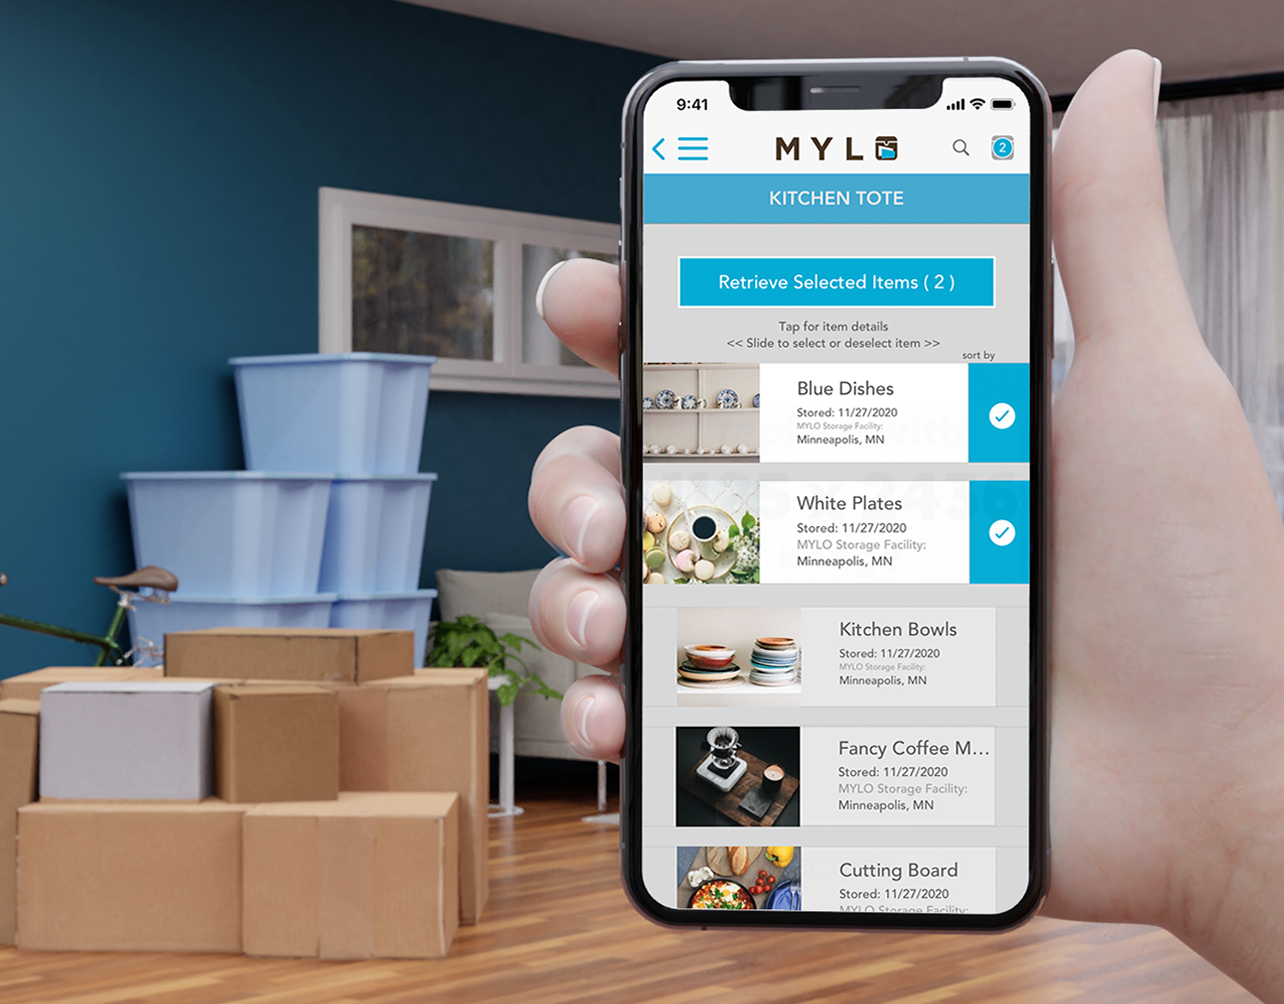
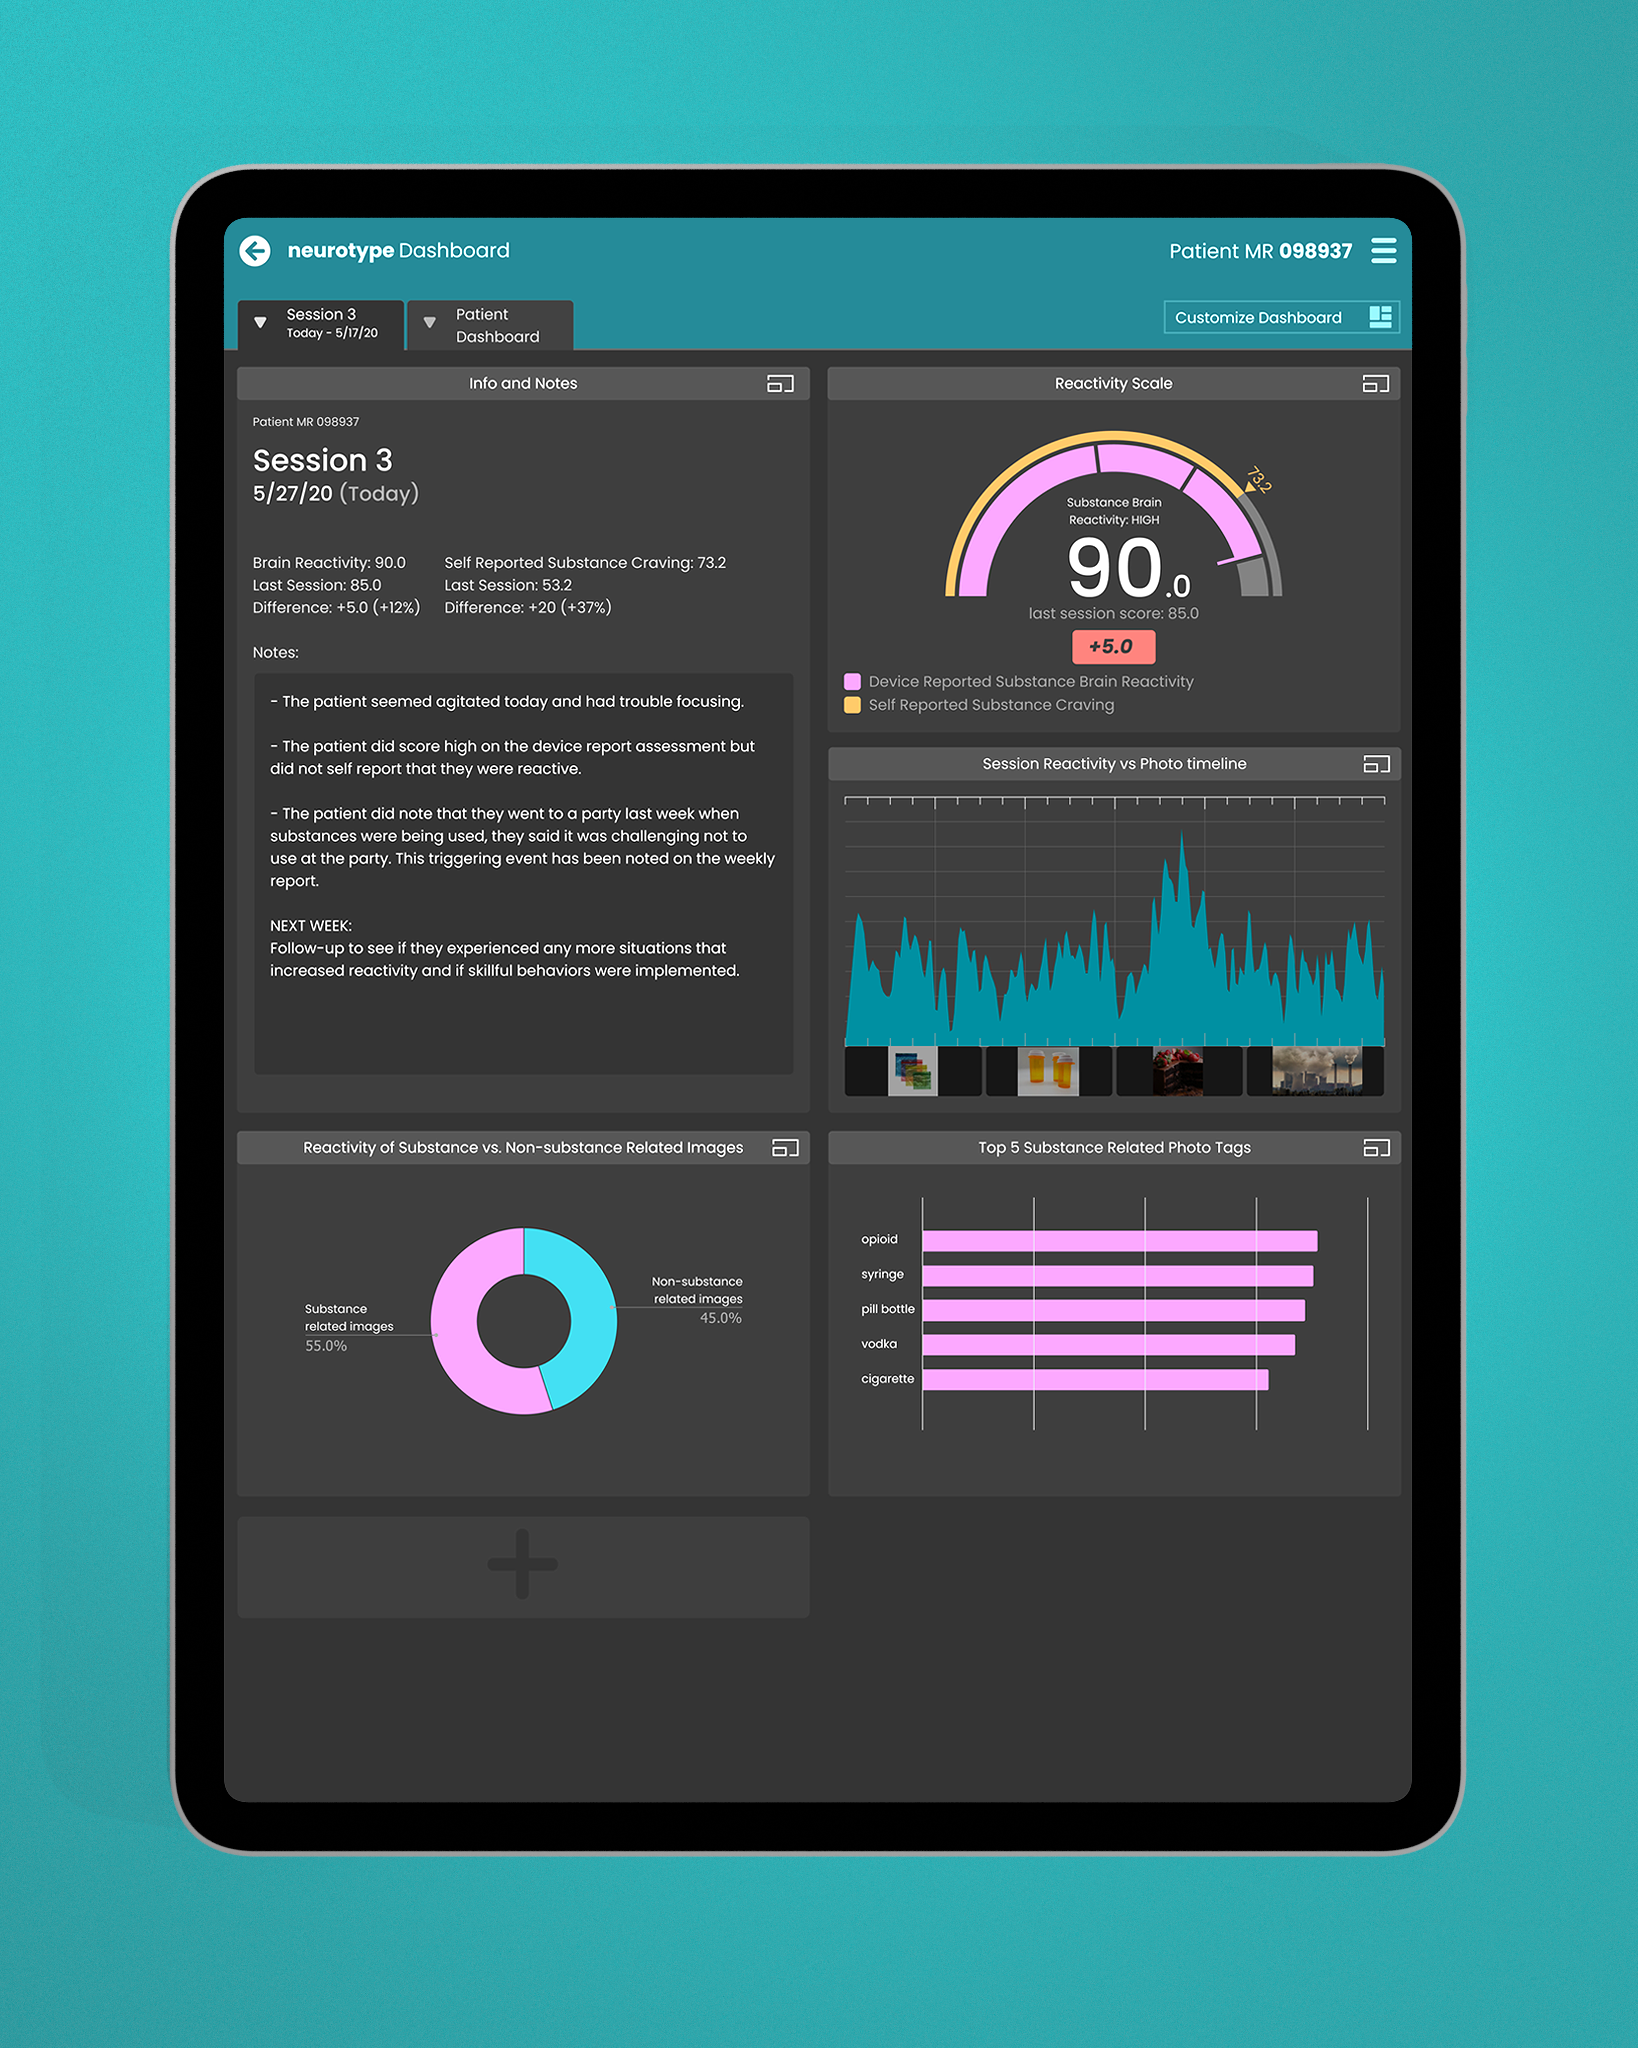
Our meeting also inspired in me the idea to create a customizable card-based data visualization interface. This approach supported practitioners’ input that each patient may require different treatments and specialized views of visualized data. I envisioned this card approach would enable the practitioner to create a unique dashboard for each patient. As a result, the practitioner can quickly view and edit the most important information for treating each patient.
To the right, you can see the central session view of the data dashboard. This first page is a quick and high-level overview of session data. The practitioner can move each card or widget around. Tapping on a card will open a detailed view of the data represented by that card.

Project Reflection
This project was fascinating. Neurotype, as a product, was in a very early stage of development, and our team successfully provided excellent solutions for our stakeholder to implement. As a result, we ended the project confidently and, if given the time, knew what our next steps would have been. If we had continued, our team would have started gathering direct perspectives from people who have experience as a patient in substance use disorder treatment. Then we also would begin building out an instructional walkthrough for test administrators. As we’ve learned, this walkthrough would support a test administrator’s ability to gather consistent and accurate readings.
In conclusion, our solution will help propel Neurotype into its next stage of development, one step closer to aiding those affected by or trying to treat substance use disorders. I am curious to see how Neurotype develops and how EEG technology will impact consumer markets.

Project Assets:


Special Thank You and shoutout to Team Neurotype!
It was great working with you all!
✋✨🧠✨🤚
🙏
❤️